
8. Optimise Queries
First Published 5 Mar 2019
Last Updated 31 Dec 2022 Difficulty level : Moderate
Section Links:
Introduction
Tests & Results
Query SQL
Query Execution Plans
ISAM Stats
Downloads
Access Europe
SQL Server Tests
Feedback
This is the eighth in a series of articles discussing various tests done to compare the efficiency of different approaches to coding.
Example databases are provided in each case so the same tests can be done on your own workstations
UPDATE 18 Oct 2022:
a) added information on the ISAM Stats feature in older versions of Access.
b) info about my presentation on this topic on 7 Sept 2022 to the online Access Europe user group.
UPDATE 31 Dec 2022:
Uploaded new version (5.25) of example app with several improvements:
a) fixed an issue with timing code and updated indexing in all 3 tables
b) added 2 more tests using subqueries and ran all tests again
c) added summary results for similar tests on SQL Server linked tables
Introduction Return To Top
There is an excellent page on Allen Browne's website devoted to various methods of improving query performance: http://allenbrowne.com/QueryPerfIssue.html
I thought it would be helpful to others to illustrate his suggestions by performing a series of speed tests showing the effect of each suggested change.
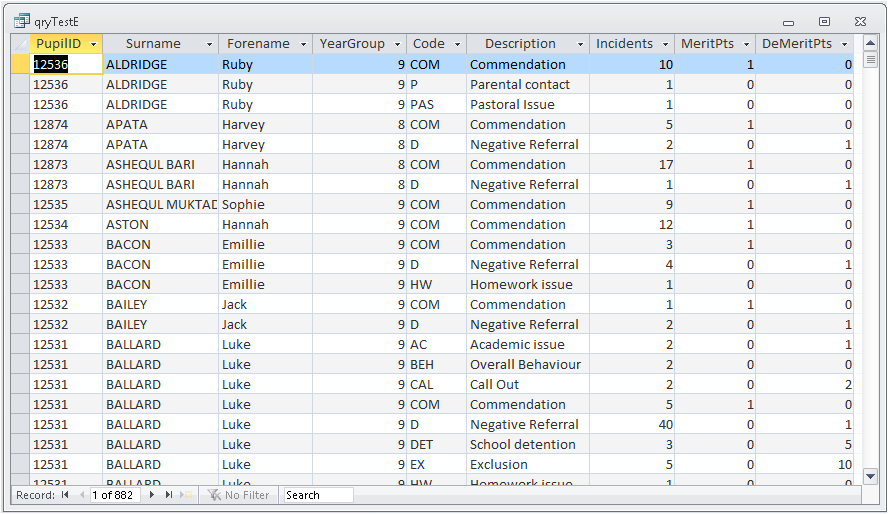
To reduce file size, the queries are based on cut down versions of 3 tables from the DEMO version of my School Data Analyser application.
All fields used in searching and filtering were indexed. The table details are as follows:
a) PupilData - 1452 records; 7 fields - Indexes: PupilID (PK text), Surname/Forename(composite text), DateOfBirth (date/time)
b) PRecords - 17680 records; 9 fields - Indexes: PastoralRecordID (PK autonumber), PupilID (FK text), Code (text), DateOfIncident (date/time)
c) PRCodes - lookup table with 26 records; 4 fields - Index: Code (PK text)
The original tables were in a linked SQL Server backend database with many more records and fields.
NOTE: All data is for fictitious students in an imaginary school.
The aim of the query is to get the count of each type of pastoral incident recorded for every student in the calendar year 2018.
The query is also filtered to those students whose date of birth was in the year 2005.
Tests & Results Return To Top
There are now 13 versions of the query with varying amounts of optimisation starting with several (deliberately) very badly designed queries.
Subsequent queries gradually become better optimised and therefore faster.
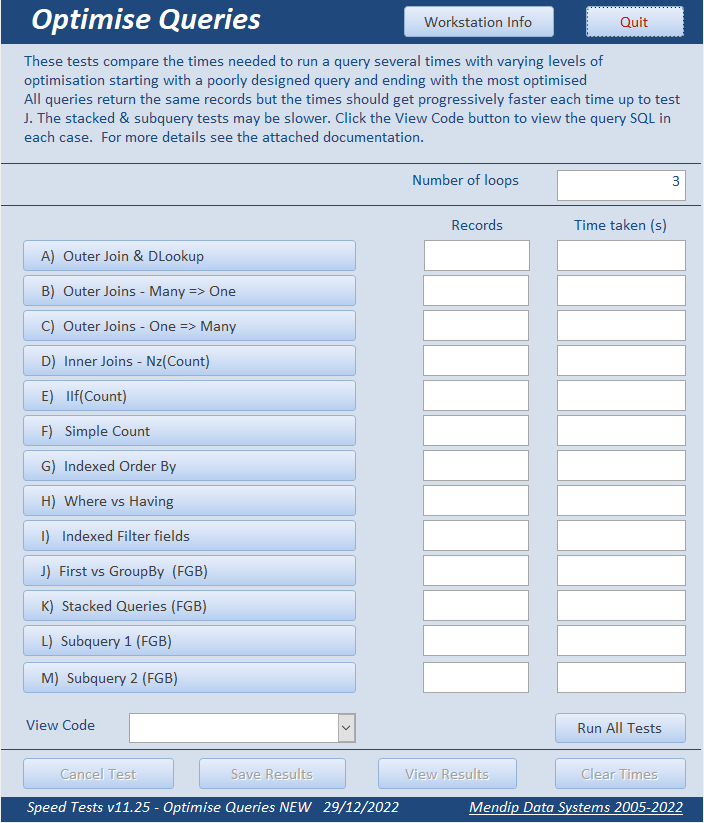
All queries return the same records (total = 882) but the times get progressively faster each time up to test J.
For comparison, the final three tests are based on a stacked query and 2 subqueries. Times for these were similar or slower.
Each test was run several times to reduce natural variations caused by other processes that may be running in the background.
The total time recorded is for the set number of loops. By default, the number of loops = 3 but this can be changed.
The fields used in each table to filter and sort the data are indexed to speed up searches:
The indexed fields are Surname, Forename, DateOfBirth, DateOfIncident
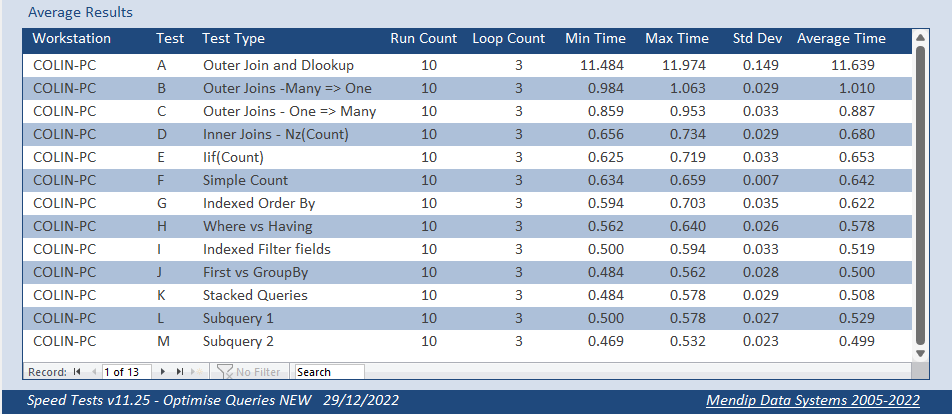
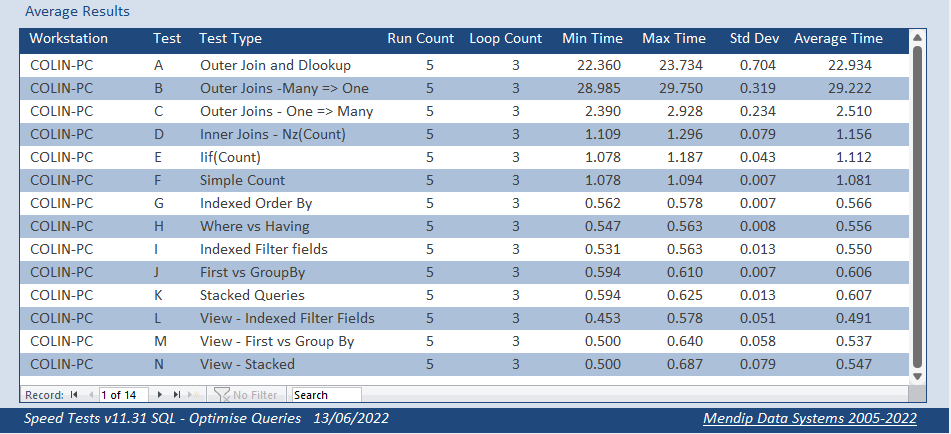
The average times recorded after running each set of tests 10 times was as follows:
Here is the results summary as a report:
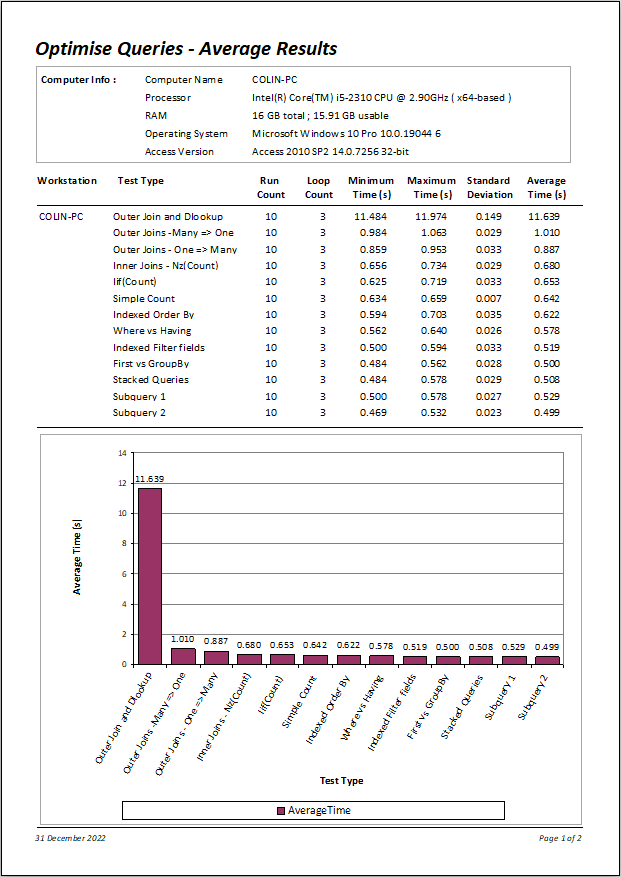
The times taken to loop through each query 3 times improved significantly from over 27 s originally down to about 0.49 s
This means it is running over 50 times faster after optimisation.
Query SQL Return To Top
The first query uses an outer join between 2 tables (PupilData / PRecords) and a DLookup value from the third table (PRCodes).
It took over 11.6 s to do 3 loops – VERY SLOW
This is the query SQL code used:
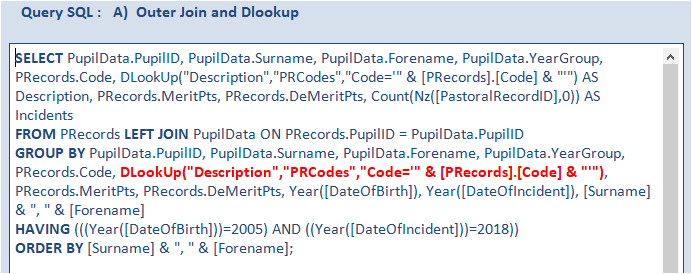
Running domain functions such as DLookup in a query is VERY SLOW as the operation must be performed in turn on each record in the query.
It also wastes resources as additional connections have to be made to the data file.
The query execution plan involves a huge number of steps as each record is checked in turn
In this case, the domain function is totally unnecessary as the same result can be obtained using a second join
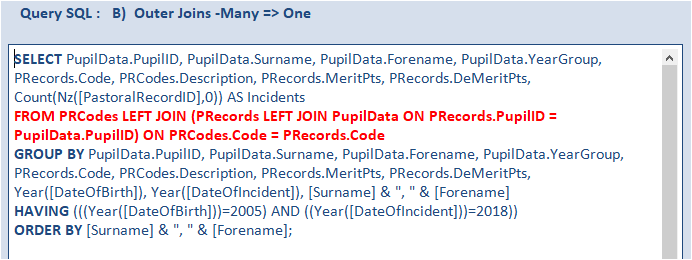
In this second query, the outer join goes from the many side of the main PRecords table: PRCodes -> PRecords -> PupilData
Although the join direction is not the best choice, the time taken is dramatically reduced to about 1.01 s.
In the third query, the direction of the joins is reversed (one to many): PupilData -> PRecords -> PRCodes.
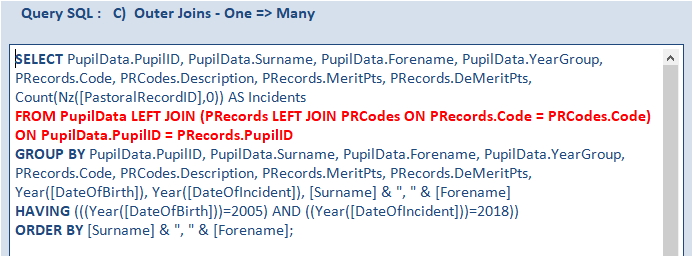
This is a more efficient process for Access to manage and the time drops again to about 0.89 s.
This example has been deliberately designed so that using inner joins will get exactly the same records.
It always makes sense to use inner joins wherever possible as the constraints limit the searching required.
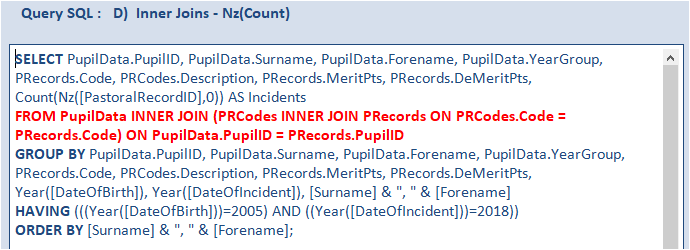
Doing so further reduces the work required from the database engine and the time drops to just under 0.68 s.
All the remaining queries are based on inner joins.
Until now, all the aggregate totals have been based on the VBA Nz function: Count(Nz([PastoralRecordID],0)).
The Nz() function replaces Null with another value (usually a zero for numbers, or a zero-length string for text).
The new value is a Variant data type, and VBA tags it with a subtype: String, Long, Double, Date, or whatever.
This will affect the sort order and can lead to incorrect results in some situations.
The fifth query replaces the VBA Nz function with the use of the JET IIf function: IIf(Count([PastoralRecordID]) Is Null,0,Count([PastoralRecordID]))
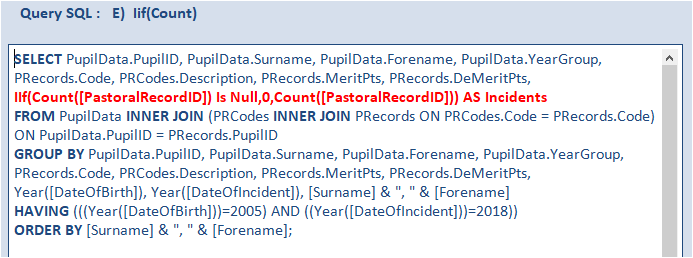
This has several advantages including avoiding an unnecessary VBA function call.
In addition, the correct data type is retained (in this case, integer) so the column sorts correctly.
This shaves almost 0.03 s off the time which has now become about 0.65 s.
However, by using inner joins as in this example, a simple count will achieve the same results
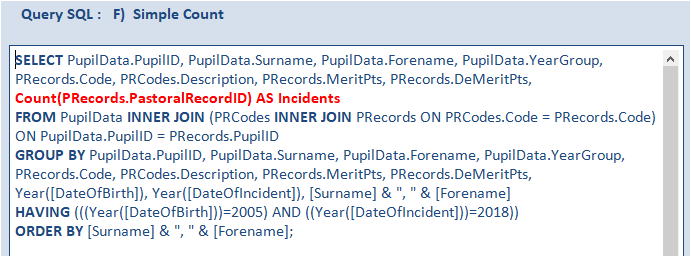
Although, the expression is simpler, the overall time is only slightly less than before – approximately 0.64 s.
All the above queries were sorted by a concatenated expression: [Surname] & ", " & [Forename]
Doing so, prevents the database engine making use of the indexes to perform the sort.
The next query fixes that, sorting by the two composite indexed fields: Surname and Forename.
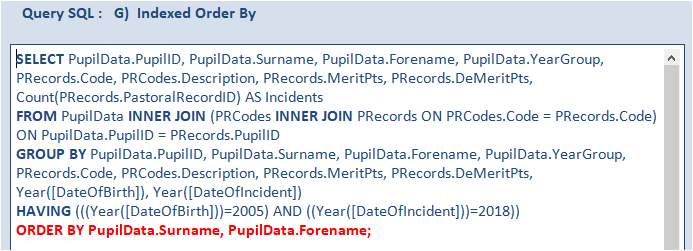
Doing so, further reduces the time required to about 0.62 s – another 0.02 s faster
Whilst the query is now running well, further improvements can still be made.
Aggregate queries (those with a GROUP BY clause) can have both a WHERE clause and a HAVING clause.
The WHERE is executed first - before aggregation; the HAVING is executed afterwards - when the counts have been calculated.
Therefore, in many cases (though not always), it can be faster to use WHERE
The next query changes the HAVING clause to WHERE and the time drops to about 0.58 s (another 0.04 s faster)
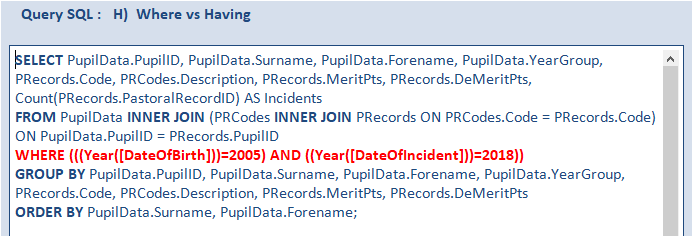
See this separate article for detailed speed tests based on HAVING vs WHERE
However, although the WHERE clause looks simple to run, it is not using the indexing of the two date fields.
A better result is obtained using the indexes by indicating a range of values for each date field:
WHERE (((PupilData.DateOfBirth) Between #1/1/2005# And #12/31/2005#)
AND ((PRecords.DateOfIncident) Between #1/1/2018# And #12/30/2018#))
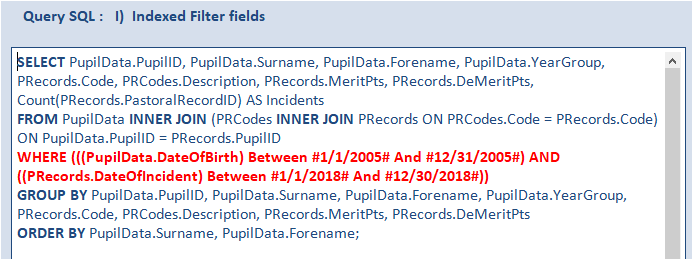
This further reduces the time by another 0.06 s down to about 0.52 s for 3 loops. Every little helps!
All the above queries have used the default arrangement, grouping all fields from each table that are not being used for aggregation.
However the PupilID field is the unique primary key field in the PupilData table.
As that guarantees each record will be unique, there is no need to group by other fields in that table.
Instead optimise the query by choosing First instead of Group By in the Total row under the other fields.
Similarly for the other fields not required for the grouping in the other 2 tables.
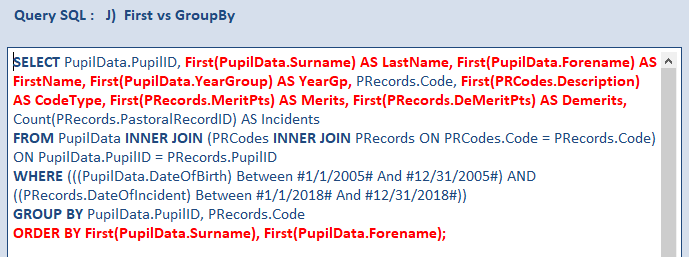
This results in a further reduction in time to just 0.5 s. The end result is now more than 23 times faster than the original 11.64 s!
Using First allows the database engine to return the value from the first matching record, without needing to group by the field.
In the query above I have used aliases for the fields now based on First.
Allen Browne also points out another benefit if you are grouping by Memo / Long Text fields:
If you GROUP BY a long text/memo field (Notes in the example), Access compares only the first 255 characters, and the rest are truncated!
By choosing First instead of Group By, JET is free to return the entire long text/memo field from the first match.
So not only is it more efficient; it actually solves the problem of long text/memo fields being chopped off.
Both stacked queries and subqueries are often useful in Access though both can be slower than using a single standard query where that is achievable.
For comparison, I created a stacked query version of test J.
The first query qryStacked1 filters the records in PupilData and PRecords for the required date ranges.
The second query qryStacked2 is an aggregate query based on that
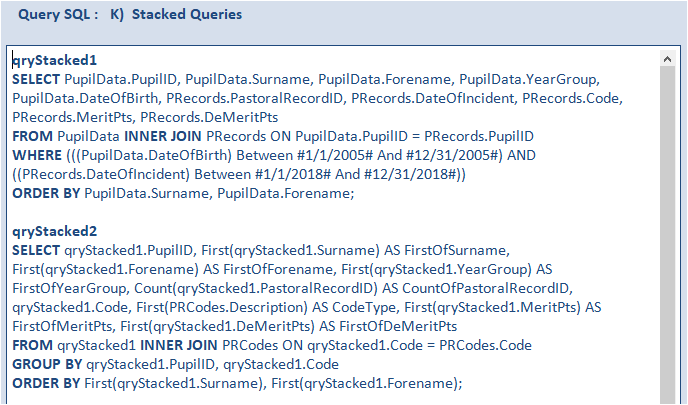
The average time for 10 tests was 0.51 s – about 0.01 s SLOWER than the single query equivalent in test J.
I repeated tests J and K on separate workstations and there was no clear winner between the 2 methods though the time difference was always very small
In this updated version, following a lengthy online discussion, I tested a subquery variant suggested by ebs17 in a thread at Access World Forums.
As I had expected, this ran slightly more SLOWLY with an average time of 0.53 s
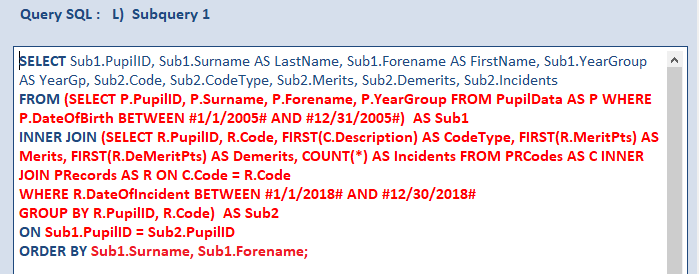
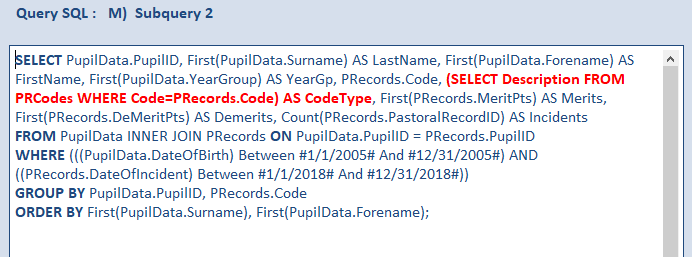
Finally, I also included a much simpler subquery I had created earlier to remove the need for the lookup table PRCodes.
In a way, this was circling back to the original query A - albeit a far better version
To my surprise, this was actually marginally FASTER at 0.499 s - technically the fastest of all by a 'massive' 0.001 s. Statistically insignificant!
NOTE:
If anyone can see ways in which the above query J can be further optimised, please do let me know!
Query Execution Plans Return To Top
You can use the JET ShowPlan feature to view the query execution plans for your queries.
By doing so, you can often obtain useful information to assist with the process of optimising your queries.
Using this feature creates a text file ShowPlan.out which can be viewed in any text editor such as Notepad
For further information, see my article ShowPlan – Go Faster elsewhere on this website.
I have attached three ShowPlan files for the above tests:
a) ShowPlanA.out – this lengthy file just covers Test A which uses a DLookup.
It should help explain why using domain functions in a query will ALWAYS be SLOW
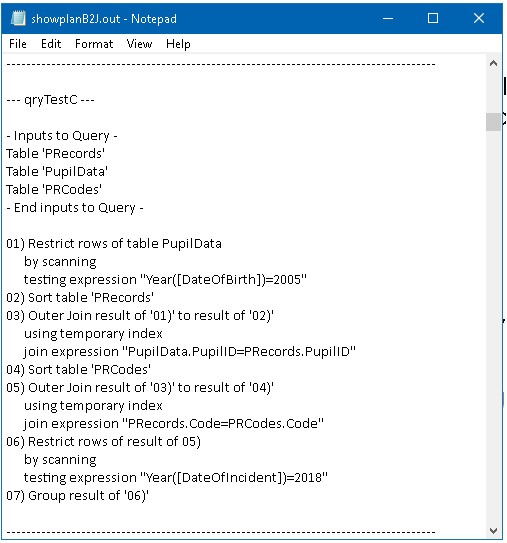
b) ShowPlanB2J.out – this covers all the other main tests: Tests B => Test J
c) ShowPlanStacked.out – this just covers the stacked query version used in Test K
As an example, this is the query execution plan for test C. It is the shortest of the first 11 query execution plans by a long way
Phrases such as scanning or using temporary index are a clear indication of a poorly optimised query
NOTE: The JET ShowPlan feature cannot show the execution plans for subqueries
ISAM Stats Return To Top
Older versions of Access up to Access 2010 included another little known feature: ISAM Stats
NOTE: ISAM = Indexed Sequential Access Method.
For more info, see this article at W3Schools.com: Indexed Sequential Access Method (ISAM)
ISAMStats was a hidden and undocumented member of the DAO reference library
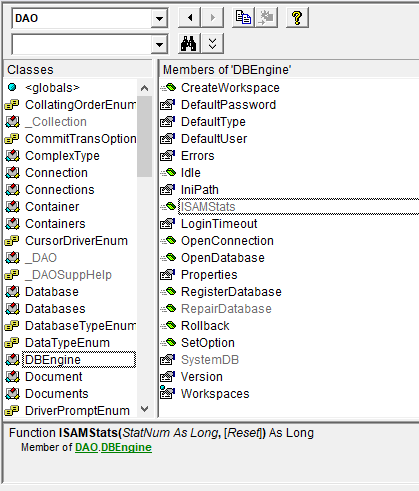
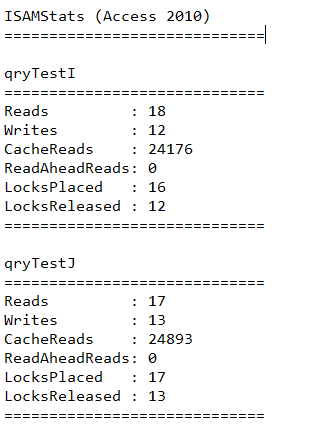
It could be used to determine the number of Disk Reads & Writes, Cache Reads, ReadAheadReads, LocksPlaced and LocksReleased
For example:
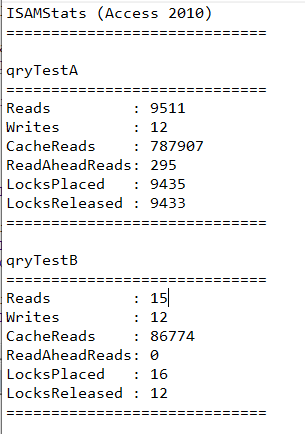
ISAM Stats for tests A & B
|
ISAM Stats for tests I & J
|
In simple terms, the smaller each of these figures are, the more efficient the query will be.
However, the feature does not give any useful information in ways of improving the efficiency.
Unsurprisingly, the ISAMStats feature was little used and was one of many features that were deprecated in Access 2013.
You can download the full set of ISAMStats results which are included in the text file below
NOTE:
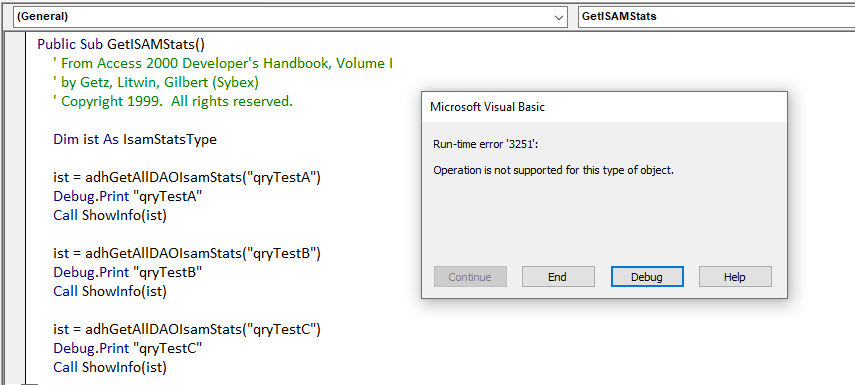
Although still listed as a hidden member of the DAO library in current versions of Access, running the ISAMStats code in versions later than 2010 will cause this error:
NOTE:
1. Information on using ISAM Stats can be found in Volume 1 (of 2) of the excellent Access 2000 Developers Handbook by Getz, Litwin & Gilbert.

See chapter 15 pages 1114-1121.
The chapter contains a large number of hints and tips on optimising Access apps and is well worth detailed study
Although over 20 years old and long out of print, copies of the book are often still available at a low price online.
I strongly recommend purchasing this if you can find a copy. Versions were also written for Access 97 and 2002
2. The code used to run this feature is provided in the module modISAMStats in the attached example database.
The code was taken from the CD accompanying the Access 2000 Developers Handbook
Downloads Return To Top
Click to download:
Example database: OptimiseQueries.accdb Approx 3.5 MB (zipped)
Query execution plans: ShowPlan.out Approx 1.5 MB (zipped)
ISAMStats results: ISAMStats.txt Approx 3 kB
PDF version of this article: OptimiseQueries.pdf Approx 1.0 MB (zipped)
Access Europe Presentation Return To Top
I ran a presentation called Optimising Queries and the JET ShowPlan to the online Access Europe User Group on Wed 7 Sept 2022.
For further details, see the information on the
Access Europe website and my own summary article on this site.
The session was recorded and the video is available on the Access Europe YouTube channel at https://youtu.be/mVe3InnJaAE or you can click below:
SQL Server Tests Return To Top
I have also performed similar tests on the original linked tables stored in SQL Server.
The two main SQL tables used cover a larger time period so have more records (and more fields):
a) PupilData - 1482 records and 127 fields
b) PRecords - 46833 records and 49 fields
c) PRCodes - lookup table with 26 records (as above) and 8 fields
The SQL data had been updated since the original dataset was created in Access and the number of records obtained in each test was slightly less (712 instead of 882)
Although the two sets of tests are not directly comparable, the trend is broadly the same.
Three additional tests were carried out on views created in SQL Server
These results will be discussed in more detail in a future article
Feedback Return To Top
Please use the contact form below to let me know whether you found this article useful or if you have any questions/comments.
Do let me know if there are any errors
Please also consider making a donation towards the costs of maintaining this website. Thank you
Colin Riddington Mendip Data Systems Last Updated 31 Dec 2022
Return to Speed Test List
Page 8
1
2
3
4
5
6
7
8
9
10
11
12
13
14
15
Return to Top
|
|
|