
Version 3.1 First Published 22 Jan 2025 Last Updated 2 Oct 2025 Difficulty level: Moderate
The long awaited VBA support for modern charts in Access is now available in all release channels for Microsoft 365.
It was included in the Current Channel update to version 2502 build 18526.20144 released on 5 Mar 2025. It has since been rolled out to all other channels .
Many thanks to Access team member, Courtney Owen, who has led the development of the improvements to modern charts over the past year or so.
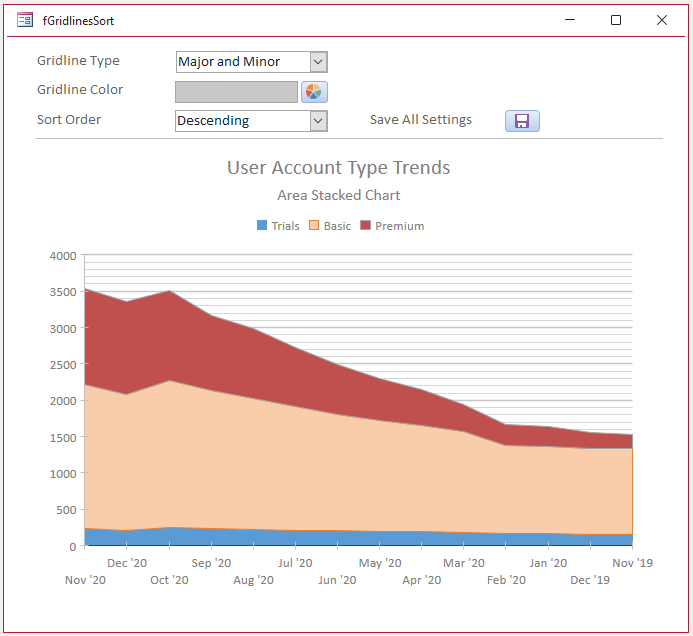
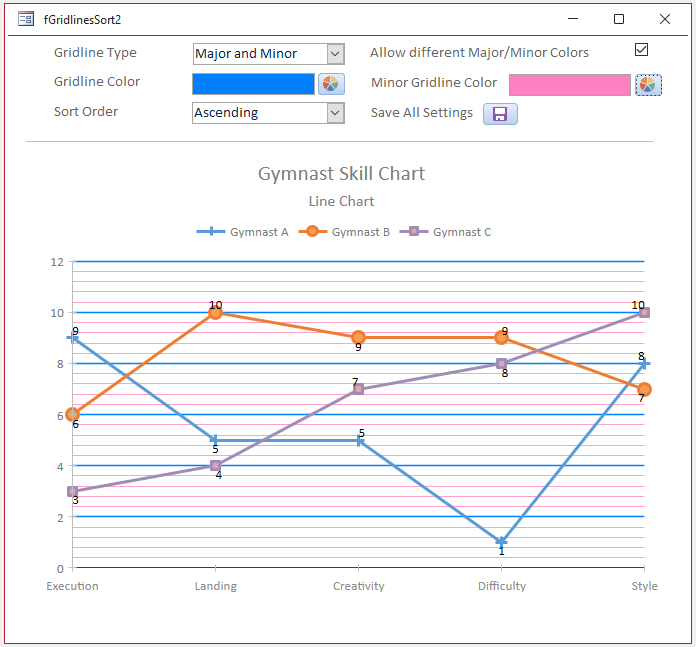
The new functionality means you can now allow users to modify the appearance of modern charts at runtime. For example, features such as gridline type / colors and sort order.
|
|
It has always been possible to set certain modern chart options in code. Those are the items available from the property sheet including:
• background color / border style
• chart title items: text / font name / font color / font size
• primary / secondary & category axes items: text / font name / font color / font size
• legend items: position / font color / font size
Until now, all other modern chart properties & settings could only be modified from a combination of the the property sheet and chart settings task pane.
These were only available in design view.
The new VBA support means that a much wider range of chart and series properties are also now available in code including:
• chart type
• gridline type / gridline color
• sort order
• line weight / marker points etc (line chart)
• DataLabelDisplayFormat / DataLabelDisplayPosition
• DashType
• DisplayBoxWhiskerDataPoints / DisplayBoxWhiskerMeanMarker
• ParetoLineColor
• WordCloudShape / WordCloudOrientation
This article will explain how each property can be modified in code, including runtime changes. An example app will be provided with all the code used in the article.
There are currently 16 different chart types, several of which have sub-types giving 25 different chart types in total.
The chart type property is acChartType with enums from 0 to 24 and property values such as acChartColumnClustered / acChartPareto etc.
A simplified property name such as Column Clustered and Pareto is shown on the property sheet.
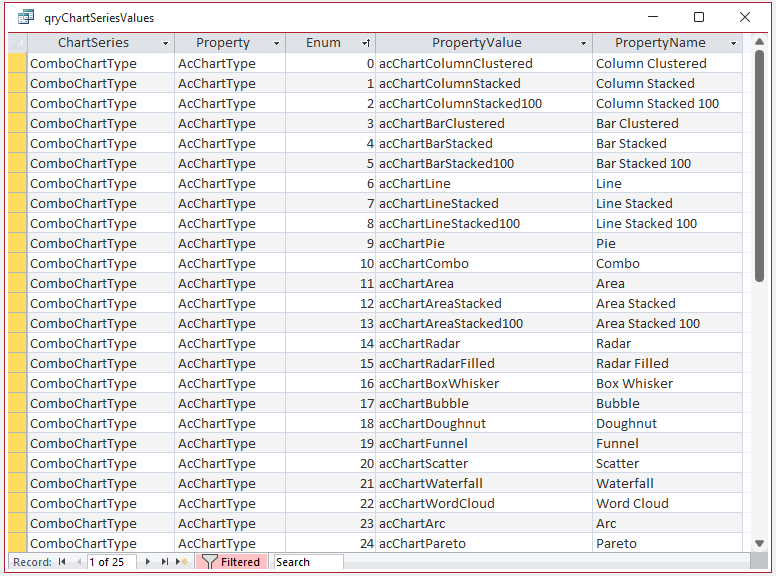
Either the enum or property value can be used in code.
The video below (04:57) shows how the different chart types can be set at runtime e.g. from a combobox or by looping through each chart type in turn from a command button:
In the form used for the above video, the combo box has two columns:
• Column(0) - Enum (bound)
• Column(1) - PropertyName
The code to change the chart type and the chart subtitle is very simple:
Private Sub cboChartType_AfterUpdate()
Me.Chart0.ChartType = Me.cboChartType
Me.Chart0.ChartSubtitle = Me.cboChartType.Column(1) & " Chart"
End Sub
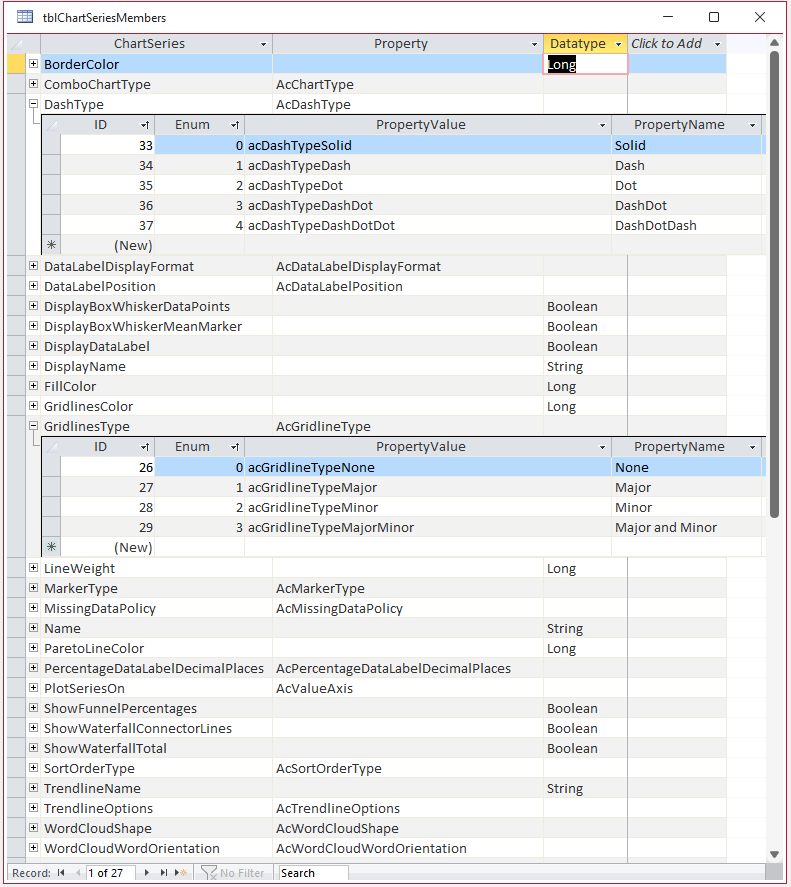
The chart series collection contains all 27 of the different chart series members. The property values and names are also shown for two of those series members (DashType and GridlineType):
The next video (06:47) demonstrates how the chart sort order together with certain series options such as fill color / show data label / gridlines type & color can be sert in code at runtime:
The code to change the chart sort order and the chart series options (display name, fill color, show data label, gridline type/color) is:
Dim I As Integer
Private Sub cboSortOrder_AfterUpdate()
'applies to all series
With Me.Chart0
For Each chtSeries In .ChartSeriesCollection
'0;none;1;ascending;2;descending
chtSeries.SortOrderType = Me.cboSortOrder
Next
End With
End Sub
'-----------------------------------------
Private Sub chkDisplayDataLabel_Click()
'loop through and apply to each individual series
With Me.Chart0
I = 0
For Each chtSeries In .ChartSeriesCollection
If I = Me.txtSeriesItem Then chtSeries.DisplayDataLabel = Me.chkDisplayDataLabel
I = I + 1
Next
End With
End Sub
'-----------------------------------------
Private Sub cmdGridlineColor_Click()
'Show color dialog for series gridline color
'Normally, the gridline option for the last series is applied
'However, this can be circumvented by setting one series to minor and another to major
Dim oleNewColor As OLE_COLOR
oleNewColor = ShowColorDialog(Me.Hwnd, True, colGrey)
If oleNewColor <> -1 Then
Me.txtGridlineColor.BackColor = oleNewColor
Me.txtGridlineColor.ForeColor = Me.txtGridlineColor.BackColor
End If
With Me.Chart0
I = 0
For Each chtSeries In .ChartSeriesCollection
'Need to use Long values for color
If I = Me.txtSeriesItem Then chtSeries.GridlinesColor = oleNewColor
I = I + 1
Next
End With
End Sub
'-----------------------------------------
Private Sub cmdFillColor_Click()
'Show color dialog for series fill color
Dim oleNewColor As OLE_COLOR
oleNewColor = ShowColorDialog(Me.Hwnd, True, colGrey)
If oleNewColor <> -1 Then
Me.txtFillColor.BackColor = oleNewColor
Me.txtFillColor.ForeColor = Me.txtFillColor.BackColor
End If
With Me.Chart0
I = 0
For Each chtSeries In .ChartSeriesCollection
'Need to use Long values for color
If I = Me.txtSeriesItem Then chtSeries.FillColor = oleNewColor
I = I + 1
Next
End With
End Sub
'-----------------------------------------
Private Sub txtDisplayName_AfterUpdate()
With Me.Chart0
I = 0
For Each chtSeries In .ChartSeriesCollection
'legend is based on display name
If I = Me.txtSeriesItem Then chtSeries.DisplayName = Me.txtDisplayName
I = I + 1
Next
End With
End Sub
NOTE: The ShowColorDialog function used above is placed in a standard module. The full module code is available to download in a separate article: Show Color Dialog
Access DevCon Presentation
I led a presentation on Programming Modern Charts at the online Access DevCon conference organised by Access MVP, Karl Donaubauer, on 10 April 2025.
For more details, see the: Access DevCon conference agenda
The screenshot below is the startup form from the example app showing the range of items covered during the session
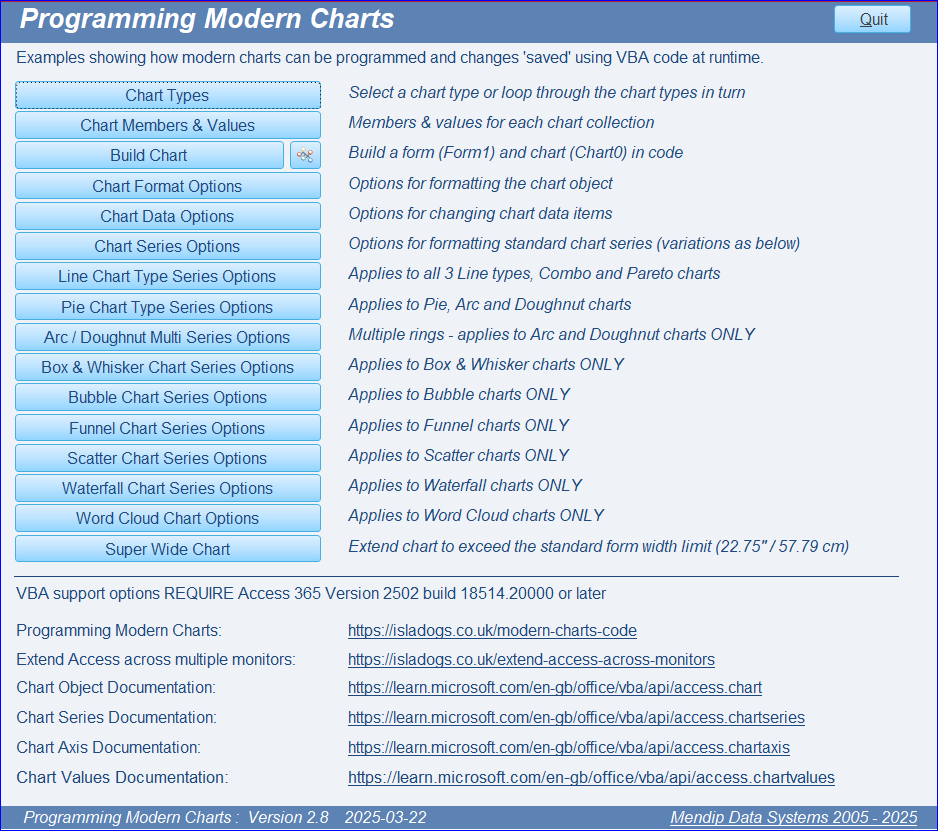
Click to download the example app (for Access 365 ONLY) and a PDF of the presentation slides from that session:
Modern Charts example app - version 2.8 ACCDB file Approx 9.5 MB (zipped)
Programming Modern Charts presentation PDF Approx 0.4 MB
UPDATE 2 Oct 2025
New version of example app with several minor changes including:
• setting chart axes programmatically - see Chart Format Options example
• added new connector line weight option to Waterfall charts (currently only available in Beta version 2510)
Modern Charts example app - version 3.1 ACCDB file Approx 7.7 MB (zipped)
COMING SOON - More examples and code based on the example app.
Feedback
Please use the E-Mail button in the contact form below to let me know whether you found this article useful or if you have any questions.
Please also consider making a donation towards the costs of maintaining this website. Thank you
Colin Riddington Mendip Data Systems Last Updated 2 Oct 2025
Return to Access Articles Page
Page 3 of 3
1
2
3
Return To Top
|
|
|