Web Page Last Updated 10 Jan 2024 (improved layout / new screenshots)
Section Links:
Student Target Grade Explorer
Incident Analysis
This is the third in a series showing different ways of filtering and grouping data in Access.
It includes two different examples showing the use of multiple combo boxes and toggle buttons to filter and group data.
I have used the methods described here in numerous databases for different clients

Student Target Grade Explorer
Return To Top
Version 1.82 Approx 1.6 MB (zipped) Updated 28 Jan 2024
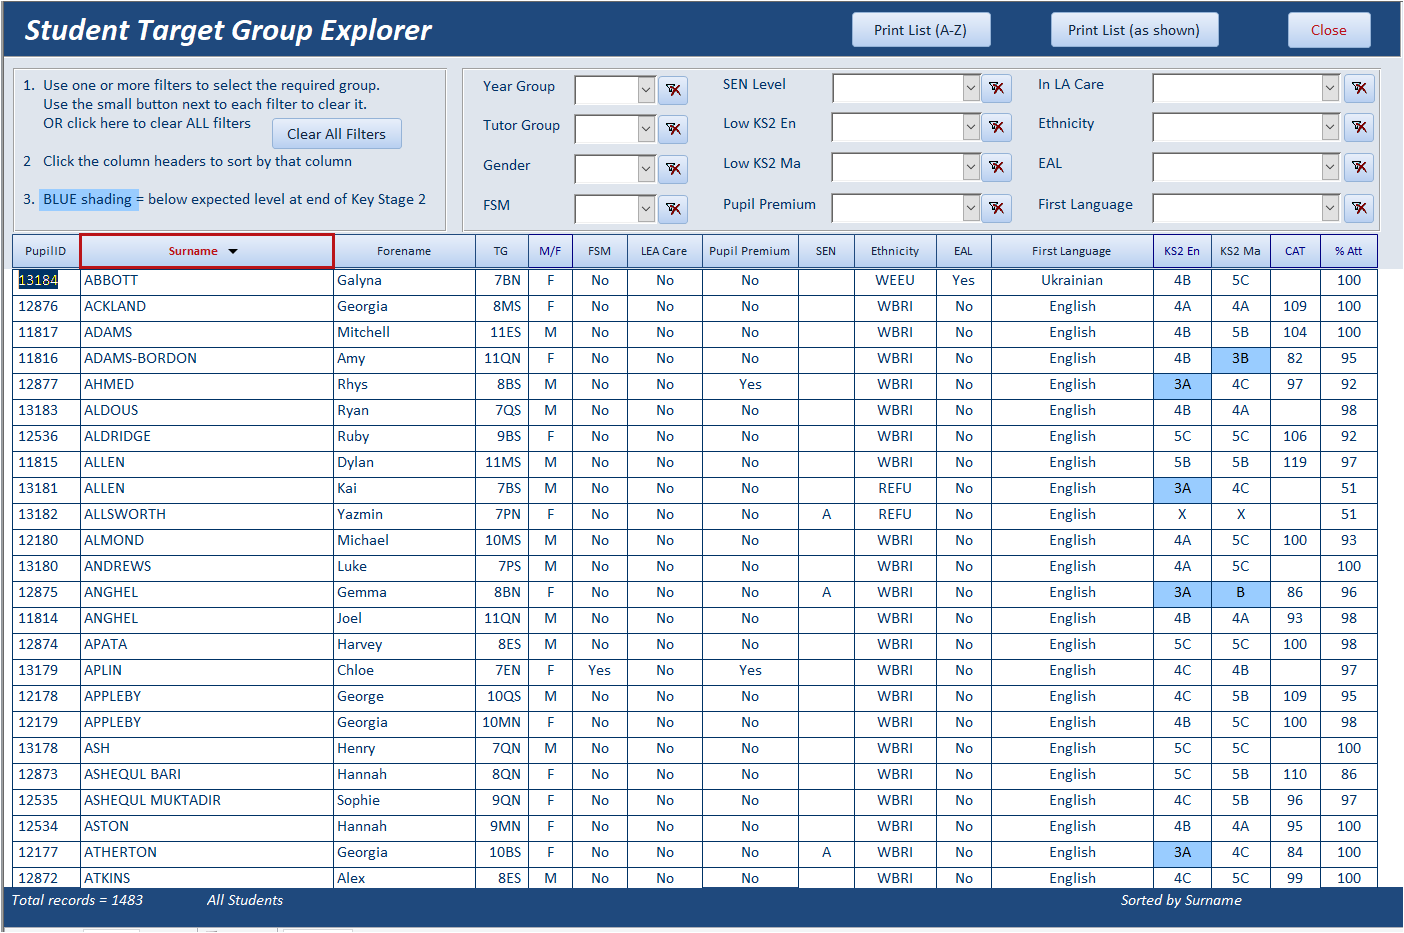
This example database demonstrates how multiple filters can be applied to the data in a form & report.
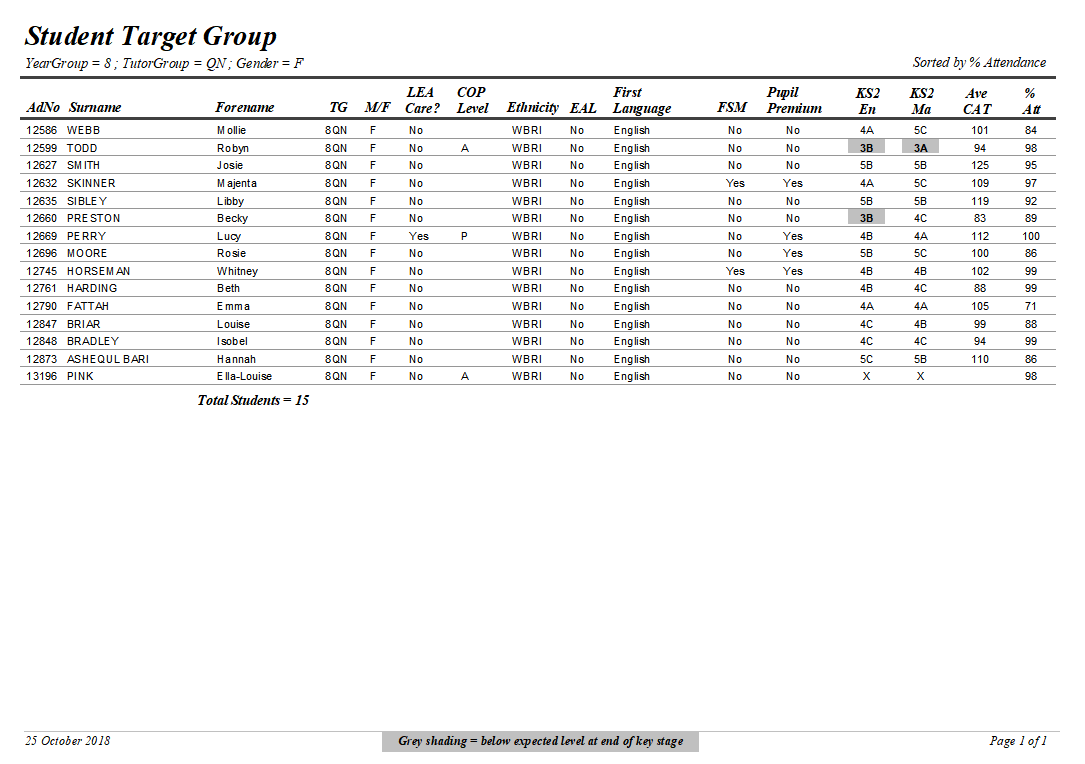
I created this form whilst working in a large UK secondary school to provide an effective way of identifying students who were in specified target groups so that appropriate action could be taken and the results analysed.
NOTE:
The dataset in the attached example is for fictitious students in an imaginary secondary school.
Up to 12 filters can be applied to gradually filter down the student list.
These include Year group / tutor group / gender / free school meals (FSM), SEN group, Key Stage 2 scores etc
Unfiltered Form
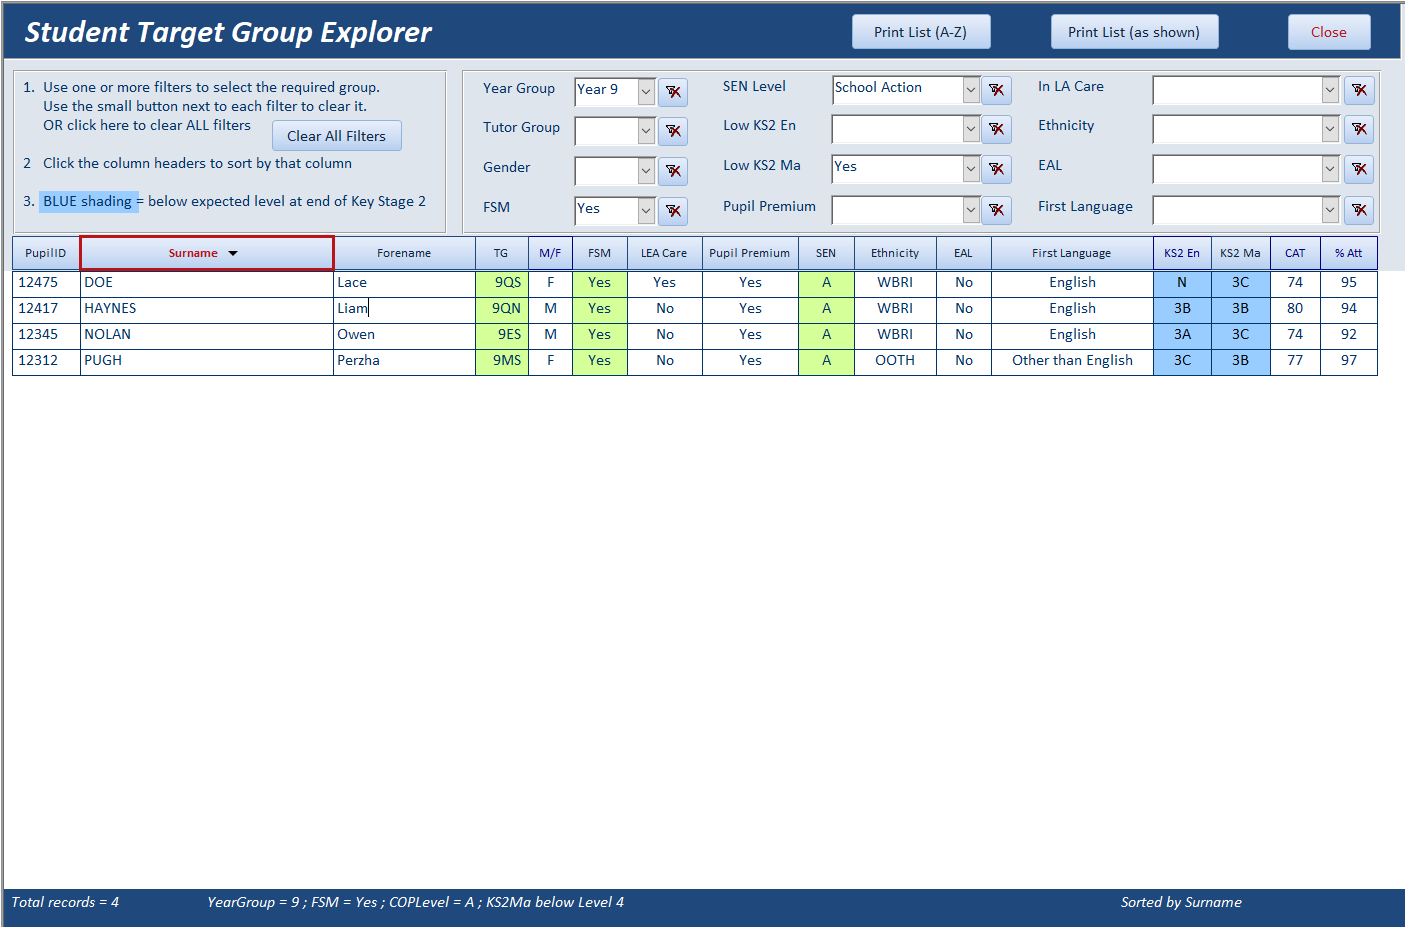
Filtered Form - the fields being filtered are shown in GREEN
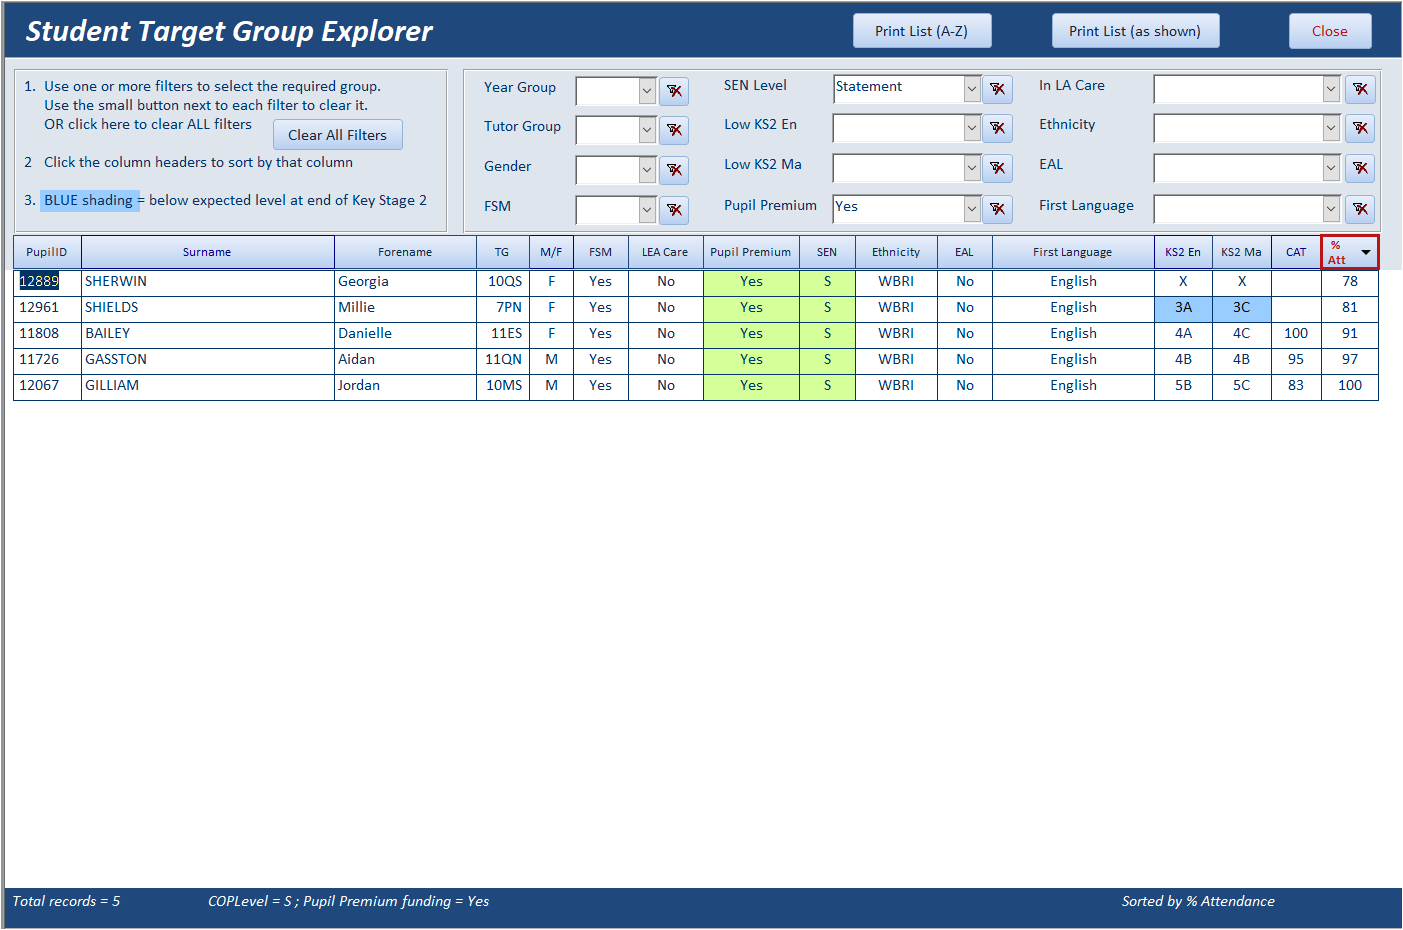
The student list can be sorted on any field by clicking on the field header. Click again to reverse the sort order.
The sort column is highlighted and the sort direction shown using up/down arrows
Form Sort 1
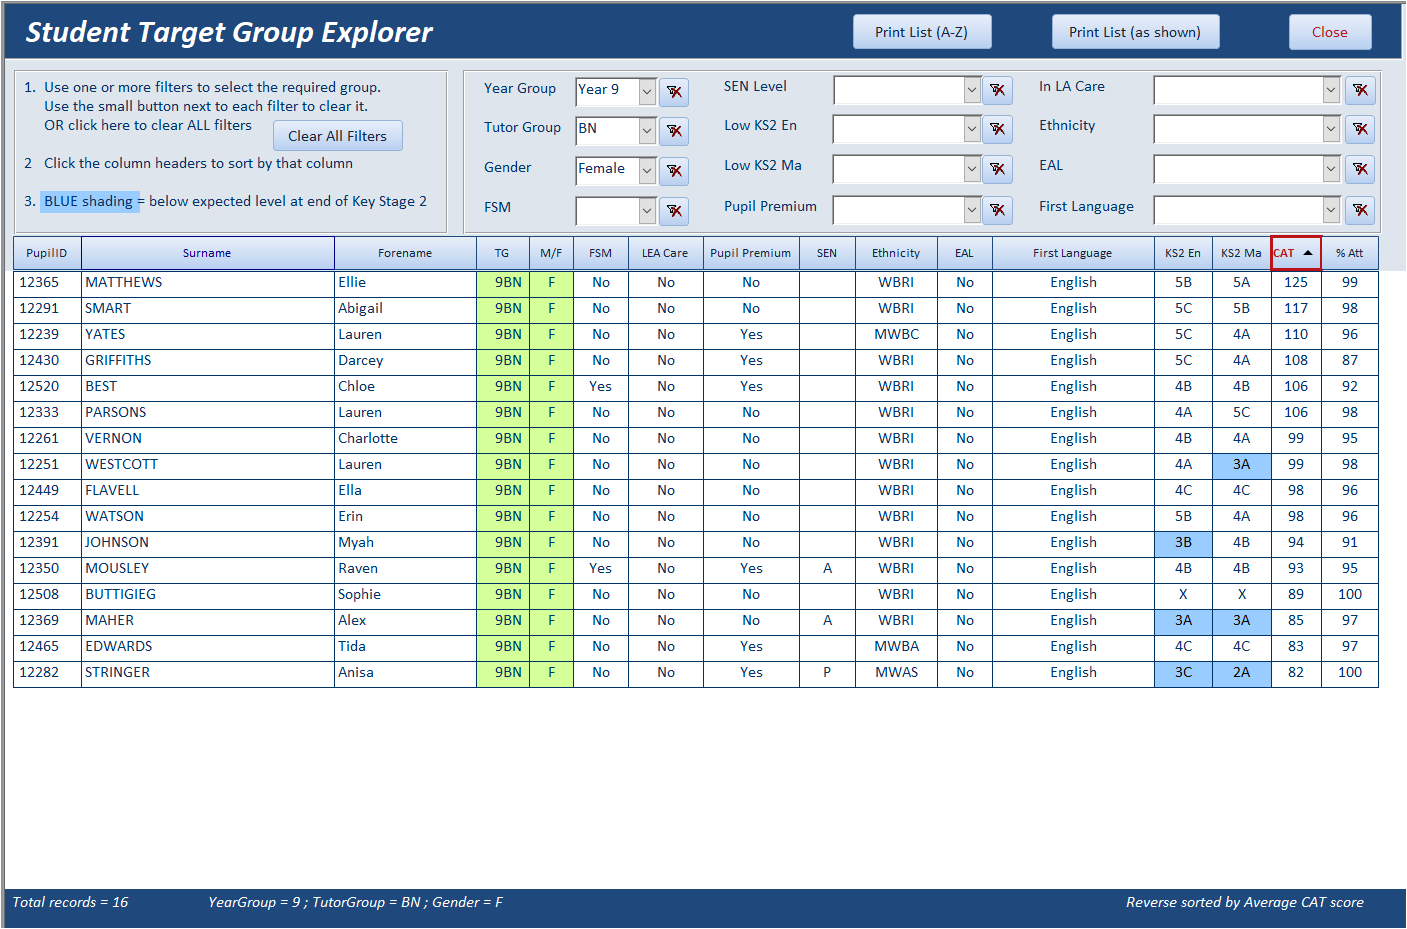
Form Sort 2
Reports can be created showing the target group either alphabetically or as displayed on the form
The report SQL and text is automatically updated to match the selections made
Report
As each filter is applied, it is saved as a string. For example:
CODE:
Private Sub cboGender_AfterUpdate()
If Nz(Me.cboGender, "") <> "" Then
strGender = " AND PupilData.Gender = '" & Me.cboGender & "'"
GetRecordSource
End If
End Sub
The GetRecordSource procedure combines the select string with all filters and the sort order to create the overall SQL string
CODE:
Private Sub GetRecordSource()
strWhere = strWhere & strYear & strTG & strGender & strFSM & strCOP & strLowEn & strLowMa _
& strPupilPremium & strEAL & strFirstLang & strEthnicity & strLEACare
'combine with strSelect (set in Form_Load) and strOrderBy (depends on user choice)
strRecordSource = strSelect & " WHERE " & strWhere & " ORDER BY " & strOrderBy & ";"
Me.RecordSource = strRecordSource
CheckFilterFormat 'used to add green shading to filtered fields
Me.Requery
GetListTotal 'shows the recordset count and a summary of the filters used
End Sub
UPDATES:
Version 1.81 16 Feb 2022 (ONLY for Access 2010 or later)
Changes include:
a) visual display of sort order using up/down arrows and highlighting of column headers (based on suggestions/code by Salvo Fricano)
b) fixed issues with sort order on report
c) modified API declarations in modResizeForm
Version 1.82 28 Jan 2024 (ONLY for Access 2010 or later)
Fixed sort order error for TG field
Click to download: Student Target Group Explorer v1.82
If you have Access 2007, please download this earlier version instead:
Click to download: Student Target Group Explorer v1.71
Incident Analysis
Return To Top
Version 1.81 Approx 2.2 MB (zipped) Updated 16 Feb 2022
This is a modified version of a form I created for a client working for Transport for London.(TfL)
The form is used to analyse incidents of vandalism and graffiti on the London tube network.
All data has been changed for this example
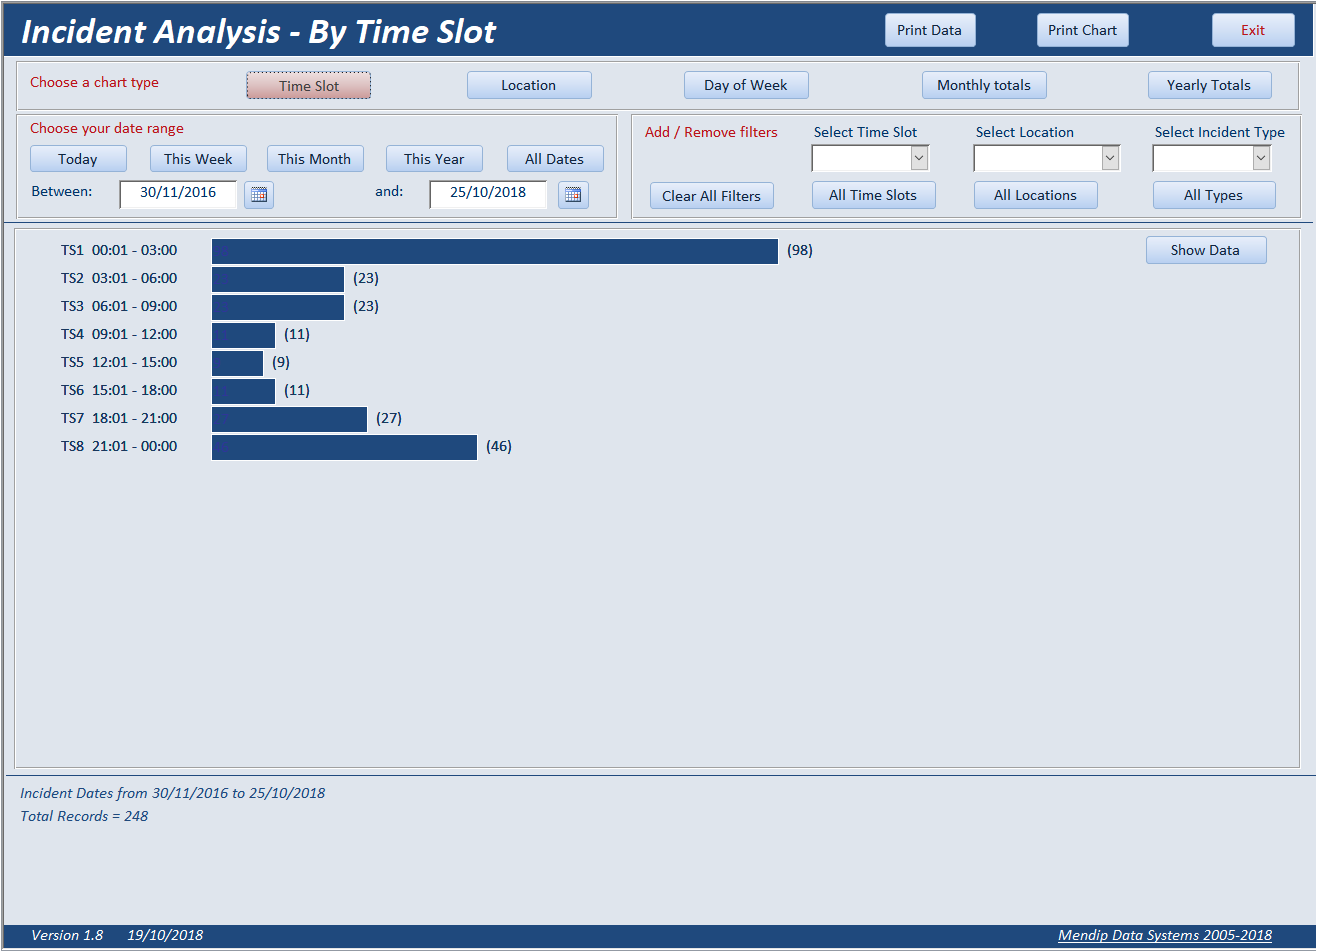
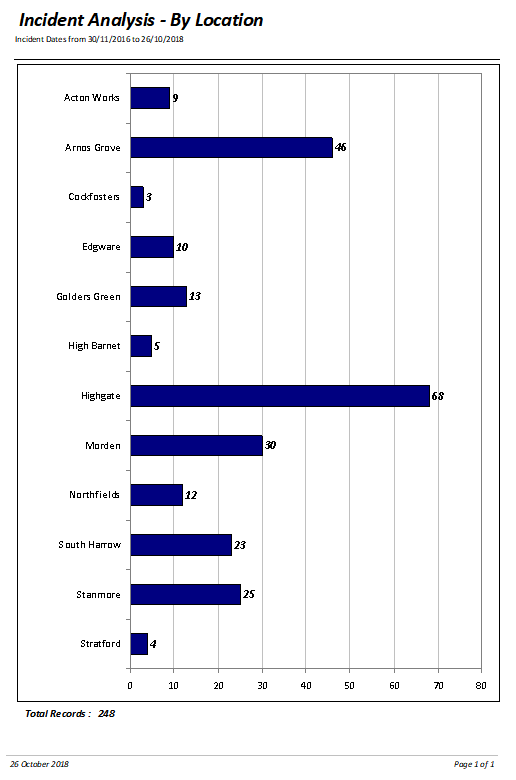
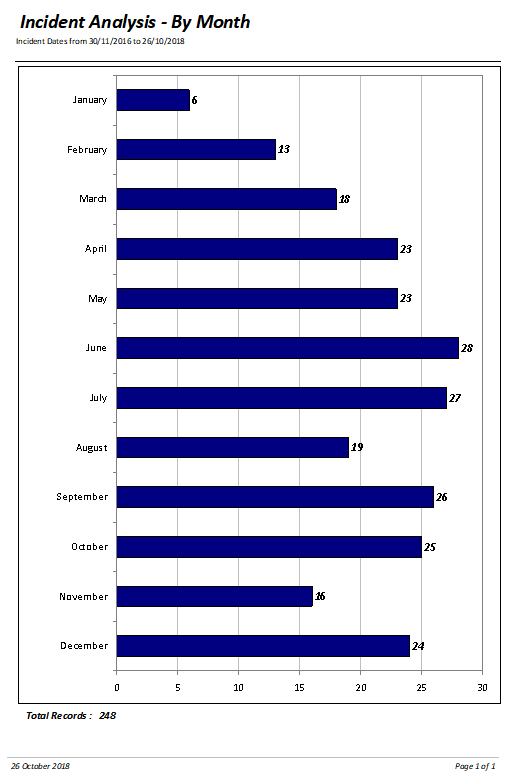
The main purpose is to show a count of the filtered/unfiltered data for each group as a horizontal bar chart.
This is done using coloured rectangles directly on the form i.e. without using the Access chart object
First click one of the toggle buttons at the top of the form to group the data by one of the following:
Time slot / Location / Day of Week / Month / Year
Next select the date range:
Today / This Week / This Month / This Year / All Dates (the default)
Alternatively enter your own preferred range of dates
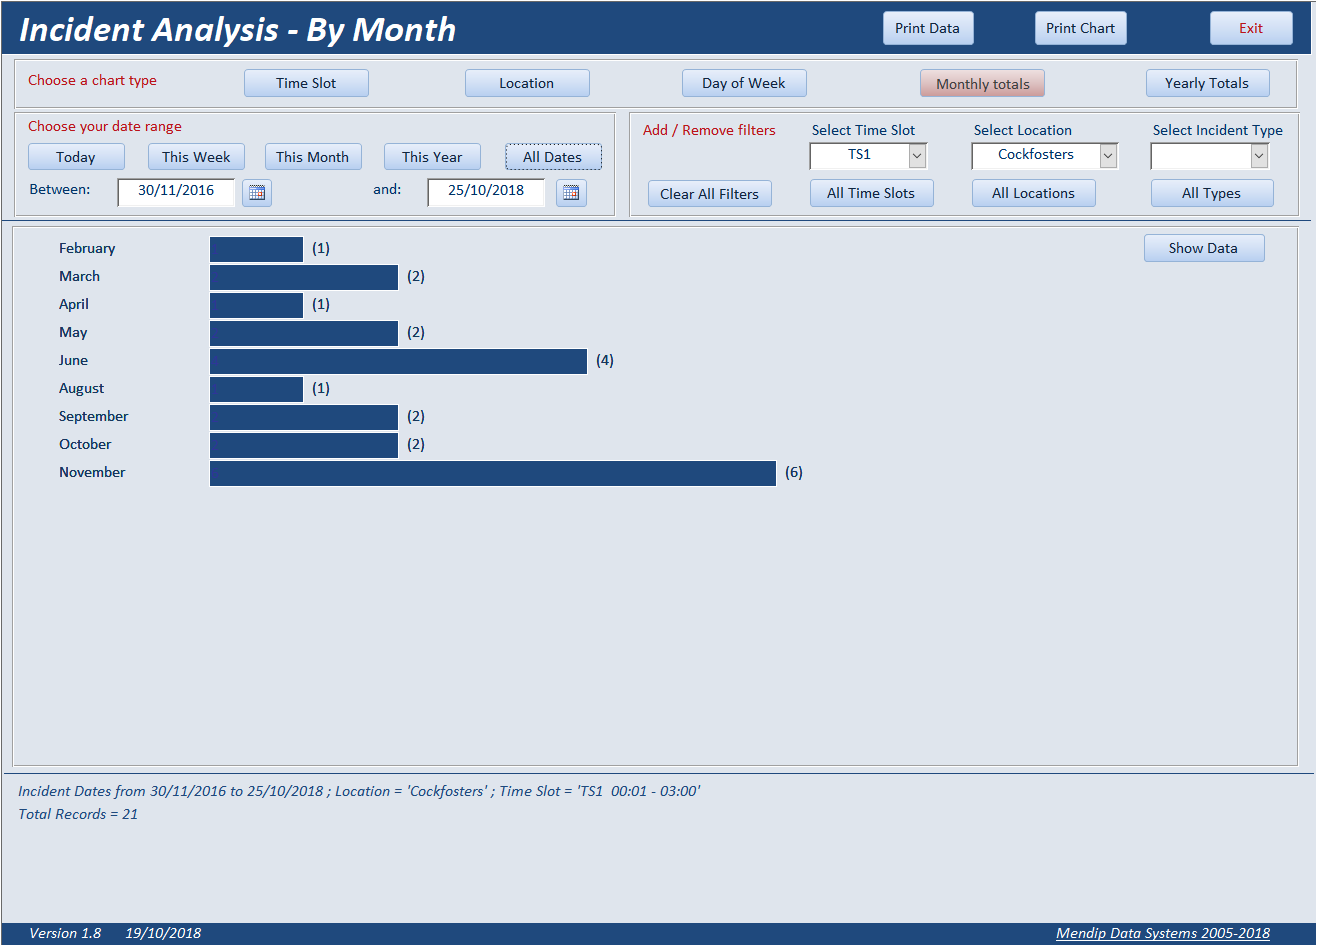
Using combo boxes, the data can also be filtered by one or more of the following:
Time Slot / Location / Incident Type
The GetRecordSource procedure uses similar code to that in the Student Explorer example app to filter and group the data.
It then stores the aggregated ‘temporary’ data in two tables tblEventsTEMP/tblEventsTOTAL.
These tables are overwritten each time that new grouping or filtering is applied.
The DisplayChart procedure then creates horizontal bar charts based on the ‘temporary’ data.
Bar Chart 1
Bar Chart 2
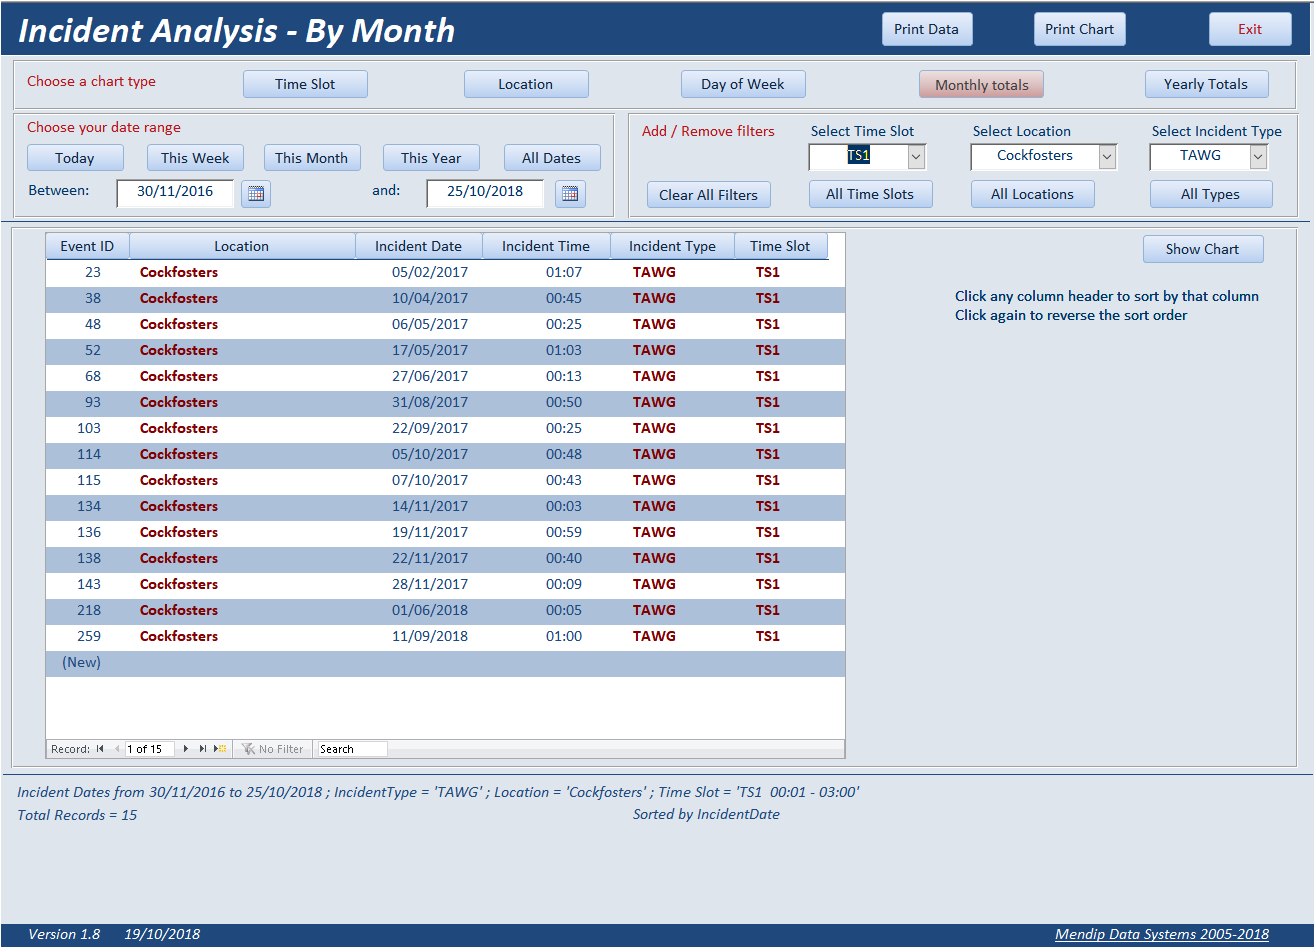
The underlying data can also be displayed. Filtered fields are displayed in BOLD RED text
Once again, the data can be sorted on any field by clicking the field header.
Filter Data
A report is available to print any of the bar charts from the form
The report SQL and text are automatically updated depending on the selections made
Report - Example 1
|
Report - Example 2
|
Click to download: Incident Analysis v1.81
Feedback
Please use the contact form below to let me know whether you found this article interesting/useful or if you have any questions/comments.
Please also consider making a donation towards the costs of maintaining this website. Thank you
Colin Riddington Mendip Data Systems Last Updated 28 Jan 2024
|
Return to Example Databases Page
|
Return to Top
|